Traditional vs. Multi-Dimensional Diversification
At RQA, we know that no matter how confident we are in a particular investment or strategy, there is always a chance that any individual return stream will not produce the results we desire at any given point in time. However, by effectively diversifying across a wide array of return streams with low correlations to each other, we can effectively reduce the material impact of these chances on portfolio returns, as discussed in our article regarding RQA’s philosophy on diversification.
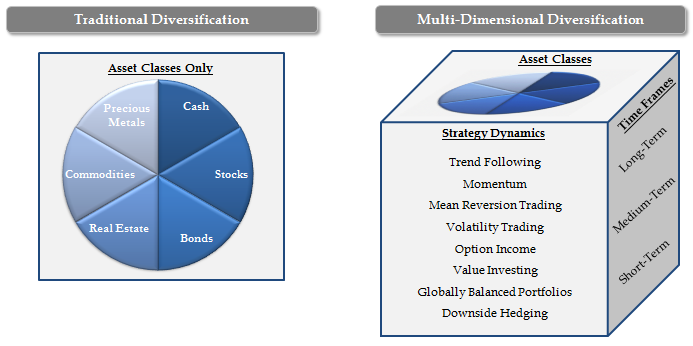
Properly diversifying a portfolio is standard practice and extensively implemented across the investment management industry. Portfolio managers, financial advisers, and individuals alike use diversification as an instrumental tool to improve the overall risk-adjusted performance of their portfolios over time. Yet, most investors only diversify across a limited set of return streams, more specifically, traditional asset classes such as U.S. stocks, international stocks, real estate, bonds, and commodities. We call this more limited diversification style Traditional Diversification, and we firmly believe there is plenty of room for improvement. Such improvement could be accomplished by expanding into other return streams which are not only diversified across asset classes, but also across time frames and strategy dynamics - a method we call Multi-Dimensional Diversification.
The Traditional portfolio: A long-term, Buy & Hold Strategy
Traditional Portfolios tend to adhere to buy-and-hold strategies with a sole focus on long-term time horizons, deriving returns from continued economic growth around the world. In other words, Traditional Portfolio returns and downside risks are heavily dependent on growth factors - factors dependent on continued economic strength, corporate growth, and bond yields that provide investors with a positive real return (i.e. yields that exceed the level of inflation). Over most of modern history, returns generated from global growth factors have been incredibly persistent and have provided investors with attractive annualized returns (particularly in the U.S. over the past 30 years), albeit with some tumultuous recessions and financial crises intertwined.
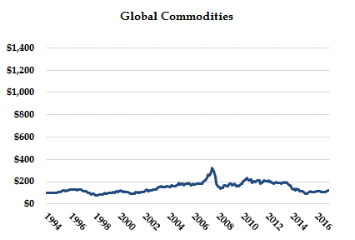
For some additional perspective, see the performance curves below for each major asset class back through 1995.
As indicated in the charts above, nearly all the major asset classes produced attractive annualized returns over the past 20+ years. However, each asset class also experienced fairly prolonged periods of peak-to-valley equity declines (or maximum drawdowns) during times of economic recession or financial crisis, for which most exceeded 50 percent (i.e. their value was cut in half, or more). It is these large and prolonged periods of negative growth that cause the most distress and anxiety for investors, often driving them to abandon each of these investments at the worst possible time.
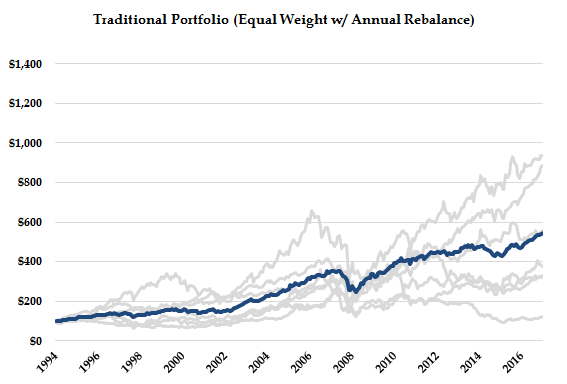
As an alternative, by combining each of these Traditional return streams into a more balanced portfolio, investors can diversify away much of their downside risk and portfolio volatility, while keeping the bulk of their returns over time. The evidence for this can be seen in the Traditional Portfolio chart below, which equally weights each asset class listed and re-balances the portfolio at the end of each calendar year. By investing in and adhering to this simple portfolio from 1995-2017, investors would have realized an annualized return of roughly 7.7 percent, nearly 80 percent of the return from U.S. stocks. Moreover, the portfolio's maximum decline over the same period would have been almost half the downside experienced in U.S. stocks and other correlated asset classes. This would have made it much easier for investors to remain rational and maintain focus on the long-term plan when times were tough.
While this simple method of portfolio construction and diversification provides material improvement over any individual asset's risk-adjusted return profile (as measured by the Reward / Risk Ratio), at RQA, we believe that there is an entire array of other proven diversification tools and risk management methods of which few investors have taken advantage. By taking a step further and seeking to diversify multi-dimensionally, investors could have the potential to: increase their expected returns; further decrease downside risk; and create a portfolio that performs independently of traditional global growth factors, perhaps avoiding severe losses during recessions and market crises.
multi-dimensional portfolios: assets, time, strategy dynamics
Multi-Dimensional Portfolios rely on a much broader array of diversified return streams, which derive their profits from multiple market factors, including long-term mean reversion (i.e. value investing), long-term global growth, medium-to-long-term trend following, intermediate-term momentum, short-term mean reversion, statistical arbitrage, etc. Each of these factors, or classes of strategies, have proven to be statistically persistent return generators over extensive periods of time. Moreover, as each of these strategies seeks to profit from a different set of market dynamics (i.e. trend following vs. mean reversion; momentum vs. value investing; buying vs. short selling), they tend to zig and zag at different times and in different market environments, by their very nature. As such, these Multi-Dimensional strategies tend to have very low correlations with one another, and therefore, are ideal candidates for building robust portfolios that can generate more consistent and reliable returns than any individual strategy or return factor.
As an example of how Multi-Dimensional Portfolio diversification works, we can start with the equal-weighted Traditional Portfolio outlined above and add two simple, evidence-based strategies that focus on different time frames and opposing market dynamics.
Add Global Trend & Momentum: This first strategy is based on trend following and momentum factors, which have been extensively researched and statistically proven by asset managers and academia alike (See Asness, CFM, Faber). For this example, we have chosen a simple strategy that stems from a highly acclaimed white paper by Mebane Faber and applied it to the Traditional assets listed above. The strategy selects to invest equally in three major asset classes (33 percent in each) every month, based on a simple 10-month moving average trend filter and monthly total return momentum rankings. More specifically, assets are chosen for investment each month if they are above their 10-month moving average (i.e. trending higher) and are exhibiting strong positive return momentum relative to the other asset classes. Otherwise, they remain in cash. These types of strategies seek to ride medium-to-long term price trends until they lose positive momentum and ultimately change direction.
Add Mean Reversion: This second strategy takes an opposing approach to the first and exploits the well-documented tendency for markets to mean revert within short-term windows of time, or in other words, they trade within statistical boundaries (See Kahneman, Thaler, Balvers). For this example, we have chosen a simplified version of a 2-day Relative Strength Index (RSI-2) mean reversion strategy on the stocks in the S&P 500, an approach popularized by famous traders, such as Larry Connors and Linda Raschke. The strategy looks to buy stocks that have fallen to the lower 20 percent of their RSI-2 range and sell (or short) stocks that have risen to the upper 20 percent.
It's important to note that each of these incremental strategies are based on opposing evidence-based behavioral phenomena: the first being the herd mentality of crowds, while the second is based on recency biases paired with irrational human behavior in times of fear (sharp market declines) and euphoria (accelerated market run-ups).
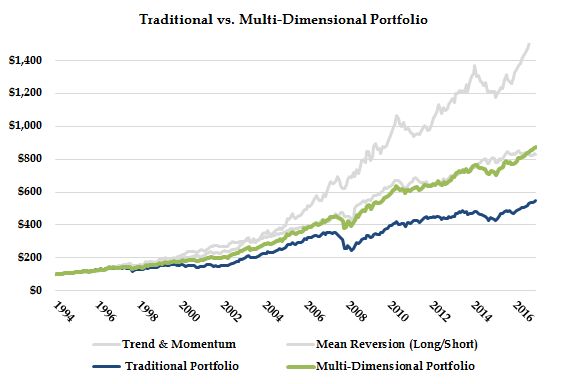
Finally, in constructing the Multi-Dimensional Portfolio below, we have assumed a 50 percent base allocation to the Traditional Portfolio, with 25 percent allocations to the Global Trend & Momentum and Mean Reversion strategies, respectively.
As indicated in the table and charts above, the addition of a medium-term Trend & Momentum strategy and a short-term Mean Reversion strategy to the Traditional Portfolio can provide meaningful benefits to returns, volatility, and downside risks, while diversifying away much of the portfolio's reliance on any return factor or strategy alone. We would also note that these relatively simple additions are just the tip of the iceberg for multi-dimensional diversification, as there are many more lowly-correlated, high-quality return streams that can be added to further improve expected portfolio results and help protect against risks inherent to Traditional Portfolios.
Disclaimer: These materials have been prepared solely for informational purposes and do not constitute a recommendation to make or dispose of any investment or engage in any particular investment strategy. These materials include general information and have not been tailored for any specific recipient or recipients. Information or data shown or used in these materials were obtained from sources believed to be reliable, but accuracy is not guaranteed.


