RQA Indicator Spotlight: Residential Real Estate Permits
In our latest analysis, we explore the trends in new residential building permits, a critical economic indicator that reflects early-stage residential construction activity. These permits, granted by local authorities, not only kickstart construction work but also ripple through the economy, impacting labor markets, consumer spending, and overall economic momentum.
The recent year-over-year data reveals a notable rise in permit issuance, indicative of a resilient economy where increased consumer confidence is driving investment in homebuilding. Moreover, a 1% retreat in mortgage rates from their peaks has buoyed mortgage demand, easing the path to homeownership.
Source: U.S. Federal Reserve, Analysis by RQA
The housing market is also finding equilibrium, with supply adjustments meeting demand, thereby fostering an environment conducive to new development, as the growth in building permits demonstrates.
The confluence of these factors—economic strength, improved borrowing conditions, and balanced market supply and demand—paints an encouraging picture for the housing sector in the near term.
Examining the six-decade trend of new housing permits reveals their predictive value regarding broader economic conditions. As the chart below illustrates, significant declines in permit issuance often align with U.S. recessionary periods. Conversely, positive movements in building permits data are commonly associated with phases of economic expansion, influencing the economy's overall growth trajectory.
Source: University of Michigan: Consumer Sentiment, NYSEArca, Analysis by RQA
In conclusion, recent trends in residential building permits show a positive shift from the low levels observed over the past two years. This upward trend is contributing positively to the near-term economic outlook
Economic Forecast Model
In January, there was a discernible increase in the RQA Economic Forecast Model, with a rise from 0.38 to 0.43 compared to the previous month. This movement underscores the strengthening momentum of the growth trends that have been unfolding recently.
Source: Analysis by RQA. Data from U.S. Federal Reserve; Bureau of Labor Statistics; Norgate Premium Data; Institute for Supply Management
The RQA Economic Forecast Model represents a consolidated composite of key economic leading indicators and market-based explanatory variables. The goal of this composite model is to present a holistic measure of primary U.S. economic growth drivers and their trends over time. (Additional detail on the model’s construction is provided here.)
Values above the zero-line are indicative of positive U.S. economic growth expectations in the near-term, and therefore, indicate economic strength and lesser chance of recessionary pressure. On the other hand, values below the zero-line represent the opposite - a more negative outlook and more elevated probabilities of the U.S. experiencing an economic contraction.
TAKING A CLOSER LOOK AT THE ECONOMIC DRIVERS
In the economic heatmap below, we are able to peak under the hood at a wide mix of underlying growth drivers in the U.S. economy. By reviewing this underlying data in more detail, we are better able to see how the underlying components of the U.S. economic growth picture are behaving through time. The indicators presented below have each proven to have predictive qualities in estimating the future direction of U.S. economic growth.
Source: Analysis by RQA. Data from U.S. Federal Reserve; Bureau of Labor Statistics; Norgate Premium Data; Institute for Supply Management
Recent trends in the leading indicator data set present a nuanced but stabilizing picture of the economy. Employment levels are holding steady, indicating job market resilience, yet there's a slight decrease in average work hours that could signal caution among employers. Additionally, U.S. manufacturing has been experiencing a downturn, contrasting with the residential real estate market, which is buoyed by an increase in permits—a sign of future construction activity and potential economic expansion.
Consumer behavior is optimistic, as reflected in rising incomes and increased spending, suggesting confidence in future economic stability. The stock market's upbeat performance and continually narrow credit spreads contrasts with the continued inversion of the yield curve, pointing to near-term investor confidence coexisting with a longer-term wary outlook by bond market participants.
Meanwhile, inflationary pressures persist, adding complexity to the economic landscape as the growth in the money supply moderates. This mixed bag of indicators underscores an economy experiencing simultaneous growth and caution, with consumer-driven sectors moving forward while production sectors and inflation measures still call for careful monitoring.
MARKET REGIME DISCUSSION
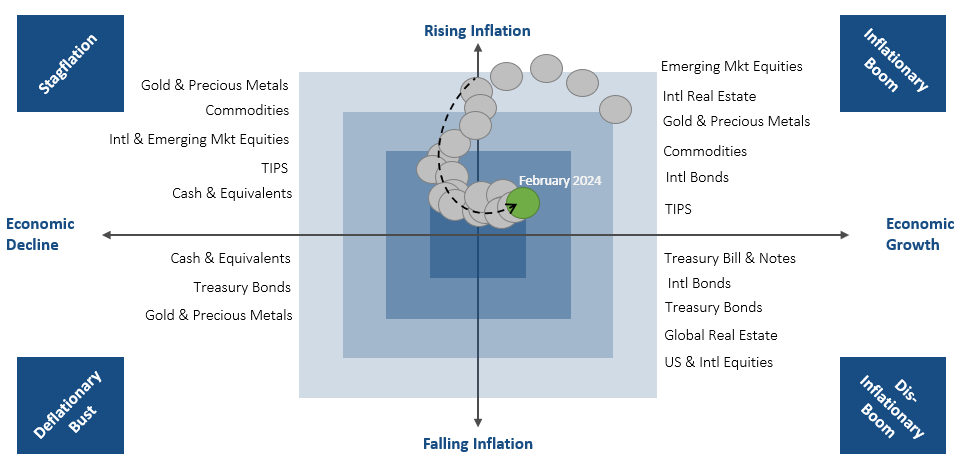
As we approach the midpoint of Q1 2024, risk assets, especially those in the AI technology sector, have sustained their upward trajectory. Conversely, fixed income securities have seen a retreat, correlating with an increase in interest rates sparked by “sticky” inflation data. The RQA Economic Forecast model indicates that the general economic climate remains supportive, bolstering market confidence. With ongoing data indicating steady near-term growth, the Federal Reserve's stance remains responsive to economic data, and the market has adjusted its expectations for near-term rate cuts, extending them further out to later in the year.
Recent inflation data have modestly exceeded forecasts, reinforcing the growing consensus among market observers that inflation could persist or even escalate. This perspective gains credence as current fiscal policies prioritize spending over deficit reduction, suggesting an increased likelihood of further inflationary pressures.
Economic growth is anticipated to continue steadily in the near term, driven by positive consumer trends and a strong labor market that are lifting economic expectations. Leading indicators are showing signs of resurgence from their recent stagnation. Although the yield curve sends a note of caution, other forward-looking financial metrics indicate a conducive environment for continued expansion.
The current macroeconomic landscape suggests an "inflationary boom" scenario, historically beneficial for risk assets including equities, real estate, commodities, and gold.
Source: RQA.


