In the current market environment with relative asset valuations near historic highs and bond yields rising off all-time lows, many investors have indicated some concerns regarding the intermediate-to-long term outlook for expected returns from traditional asset classes, particularly stocks and bonds. Additionally, our own internal models and analyses at RQA are indicating expected nominal returns from U.S. stocks of roughly 0%-5% over the next 10-years, while the yield to maturity (i.e. expected total return) on 10-year treasury notes is now dancing around 3%. Moreover, the expected real returns (i.e. net of the Fed's target inflation rate of 2%) from these asset classes range from -2% to 3% over the same period. (We should also note that our forecasts are fairly consistent with those from other institutions, including Vanguard, AQR, and Morningstar.)
So, what can investors do to potentially outpace these return expectations over the foreseeable future? Outside of using margin debt to leverage the overall risks and returns from their portfolios, there are two potential options from our perspective:
- Reallocate the portfolio into riskier assets with higher expected returns, such as high yield bonds, international and emerging market equities, and domestic value-oriented stocks; OR
- Layer on high-quality "alpha overlay" return streams that seek to add purely incremental returns to the portfolio, while potentially enhancing overall diversification benefits and downside risk protection.
Within option #1, investors would increase their allocations to asset classes with higher required yields or more "reasonable" valuations. The problem with this first option is the return forecasts for most of these asset classes are only slightly higher (roughly 1%-2%) than those projected for U.S. equities overall. And, historically these markets have exhibited higher degrees of volatility and downside risk in the later stages of global economic cycles when expectations for continued growth typically start to wane. As such, the upside potential is often expected to be limited; the downside risk exposure can be substantial; and the incremental diversification benefits from these asset classes would likely be minimal, at best.
On the other hand, alpha overlays (option #2) can further diversify and augment a portfolio's returns by layering on incremental alternative return streams that are independent and uncorrelated to traditional assets classes.
Alpha overlays explained
In its simplest terms, an alpha overlay is an incremental return stream generated by actively managing available portfolio cash and margin, while leaving the base portfolio's core investments largely intact. Investors can effectively add alpha overlay strategies that are incremental to the base portfolio by:
i) using available cash and equivalents in the portfolio as active trading capital;
ii) conservatively using instruments with inherent leverage and low margin requirements, such as futures and option contracts; and/or
iii) implementing strategies that maintain a net zero exposure to the markets (i.e. market neutral, long/short strategies), which are executed by balancing long and short trade positions so that the net cash outlay from the portfolio is near zero.
Some examples of alpha overlay strategies include: short-term position trading, market neutral (i.e. long/short) investing, option income generation, trend following and momentum, and venture capital. All of these strategies, along with many others, have shown persistent returns over vast periods of time. Moreover, they have remained uncorrelated to global economic growth factors, traditional asset classes, and other alternative strategies, making them not only good sources of additional return but valuable portfolio diversifiers, as well.
Building a Traditional Alpha Overlay Portfolio
To better explain and further illustrate the alpha overlay approach, we can review a simple example. The first step is to start with a base portfolio, which can be any asset class or portfolio of choice, such as the S&P 500, U.S. bonds, or a globally diversified portfolio. For this example, the base portfolio will be the same Traditional Portfolio outlined in Taking Diversification A Step Further, which is a simple equal-weight portfolio consisting of U.S. stocks, international and emerging market stocks, real estate, long-term treasuries, gold, and commodities.
Figure 1: Traditional Portfolio and Component Asset Class Performance (1995-2017)
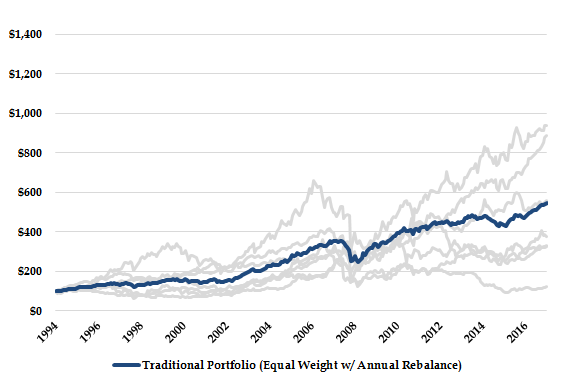
Figure 2: Traditional Portfolio and Component Asset Class Equity Curves (1995-2017)
As depicted in Figures 1 and 2 above, between 1995 and 2017, this simple base portfolio would have generated an annual return of nearly 8% and experienced annualized volatility of 10%, resulting in a Return/Risk ratio of 0.79. Overall, this diversified portfolio's risk-adjusted return profile is fairly attractive and exceeds that of any of its individual component asset classes; however, by conservatively adding alpha overlay strategies, there is the potential to further enhance the portfolio's absolute and risk-adjusted performance.
Adding the Alpha Overlays
The next step in building an alpha overlay portfolio would be the addition of viable alpha overlay strategies on top of the base portfolio. The strategies that we will consider will be the Short-Term Mean Reversion and Intermediate-Term Global Trend and Momentum strategies outlined in our prior post, as each strategy can be properly executed with conservative amounts of portfolio capital and their correlations to the base portfolio are low enough to provide additional diversification benefits.
To further detail the minimal capital requirements, the short-term strategy uses small amounts of trading capital (1%-2% per trade) over small windows of time (1-5 days), and therefore, available cash in the portfolio or small amounts of brokerage margin can be used to effectively execute the strategy as a pure alpha overlay. The intermediate-term strategy, on the other hand, trades much larger positions (10%-15%) over longer time frames (1-24 months). However, its exposure to global markets can easily be obtained through financial instruments with built-in leverage and small cash margin requirements, namely future or option contracts, making it another viable alpha overlay.
By starting with a 100% allocation to the standard base portfolio and then conservatively layering on 10% incremental allocations to each of the alpha overlay strategies described above, the portfolio would have experienced the following results for the 1995-2017 period.
Figure 3: Traditional Portfolio v. Traditional Alpha Overlay Portfolio Performance (1995-2017)
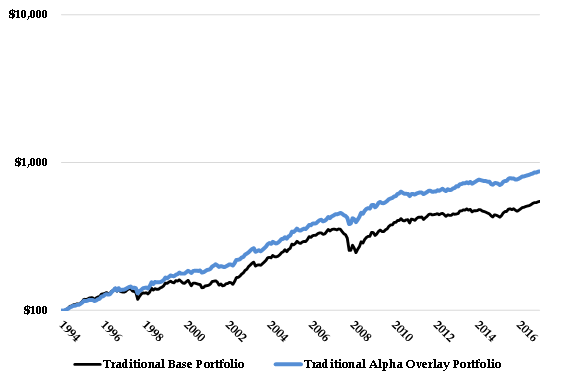
Figure 4: Traditional Portfolio and Traditional Alpha Overlay Portfolio Equity Curves (1995-2017)
As can be seen in Figures 3 and 4, the addition of the Short-Term Mean Reversion and Intermediate-Term Global Trend and Momentum strategies as alpha overlays would have increased annual returns from less than 8% to nearly 10%, modestly increased portfolio volatility, and left maximum peak-to-valley drawdown (i.e. the extent of downside volatility) essentially unchanged. As a result, the overall portfolio's Return/Risk ratio increased from 0.79 to 0.94, meaning the alpha overlays would have successfully enhanced the portfolio's absolute and risk-adjusted returns.
multi-dimensional Diversification & alpha overlays
As noted above, alpha overlays can be applied to essentially any base portfolio or asset class of choice. Moreover, as discussed in Taking Diversification A Step Further, a Traditional Portfolio's risk profile can be materially improved by diversifying multi-dimensionally - across asset classes, time frames, and strategy dynamics. As such, it stands to reason that the risk-reduction capabilities of multi-dimensional diversification paired with the incremental return potential from alpha overlays should result in an even more optimal portfolio solution. For illustrative purposes, Figures 5 and 6 below examine the combination of multi-dimensional diversification and alpha overlays by starting with the Multi-Dimensional Portfolio from our prior post as the base and layering on the 10% alpha overlay allocations consistent with the methodology outlined above.
Figure 5: Multi-Dimensional Portfolio v. Multi-Dimensional Alpha Overlay Performance (1995-2017)
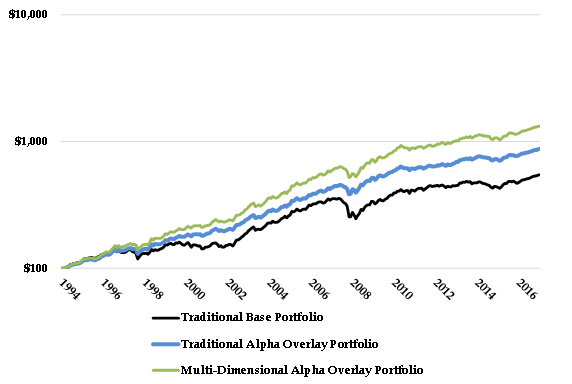
Figure 6: Traditional and Multi-Dimensional Alpha Overlay Portfolio Equity Curves (1995-2017)
As shown in Figures 5 and 6, using a Multi-Dimensional Portfolio as the base and layering on the Short-Term Mean Reversion and Intermediate-Term Global Trend and Momentum strategies as alpha overlays would have increased annual returns from nearly 10% to 12% and modestly increased portfolio volatility and maximum drawdown, taking the portfolio's Return/Risk ratio up from 1.31 to 1.38. More importantly, however, when compared to the original Traditional Portfolio, the performance enhancement is far more significant. Most notably, annual returns would have increased by over 50% (8% to 12%), while the maximum drawdown over the full period would have declined by over 40% (-31% to -18%).
In conclusion, it is RQA's view that Traditional Portfolios can achieve greater returns without materially increasing downside risk through the conservative use and layering of alpha overlay strategies. In addition, by restructuring a base portfolio with the goal of multi-dimensional diversification in mind, investors can significantly improve the risk profiles of their portfolios, reducing downside exposure and alleviating the reliance on any dominant return factor (e.g. economic growth) or individual strategy. We would note that these overlays are relatively simple examples, and there are many more lowly-correlated, high-quality alpha overlay return streams that can be added to improve expected portfolio results further.
Disclaimer: These materials have been prepared solely for informational purposes and do not constitute a recommendation to make or dispose of any investment or engage in any particular investment strategy. These materials include general information and have not been tailored for any specific recipient or recipients. Information or data shown or used in these materials were obtained from sources believed to be reliable, but accuracy is not guaranteed. Furthermore, past results are not necessarily indicative of future results. The analyses presented are based on simulated or hypothetical performance that has certain inherent limitations. Simulated or hypothetical trading programs in general are also subject to the fact that they are designed with the benefit of hindsight.


